❄️Winter sale! Get 20% off with code WINTER at checkout
Feature
Logging
Volca comes with a logging setup that aligns with best practices for TypeScript and Node.js. A good logging setup enables you to quickly find, diagnose and fix issues in production.
Technologies
How is it built?
Learn more about the technologies behind this feature.
TypeScript
TypeScript's explicit type annotations and IDE support enhance code readability and facilitate seamless navigation and refactoring, making it a reliable choice for implementing a maintainable logging solution in Node.js and TypeScript applications.
AWS CloudWatch
AWS CloudWatch is a powerful logging solution due to its seamless integration with other AWS services, allowing you to aggregate and analyze logs for your SaaS. CloudWatch provides real-time insights, automatic scaling, and comprehensive monitoring capabilities, making it a versatile and efficient choice for managing logs for SaaS applications.
Winston
Winston is a widely-used logging library for Node.js and TypeScript. This library allows developers to tailor logging output to various environments and needs. Its modular design, combined with customizable log formats and levels, makes it a trusted choice for the Volca boilerplate.
Screenshots
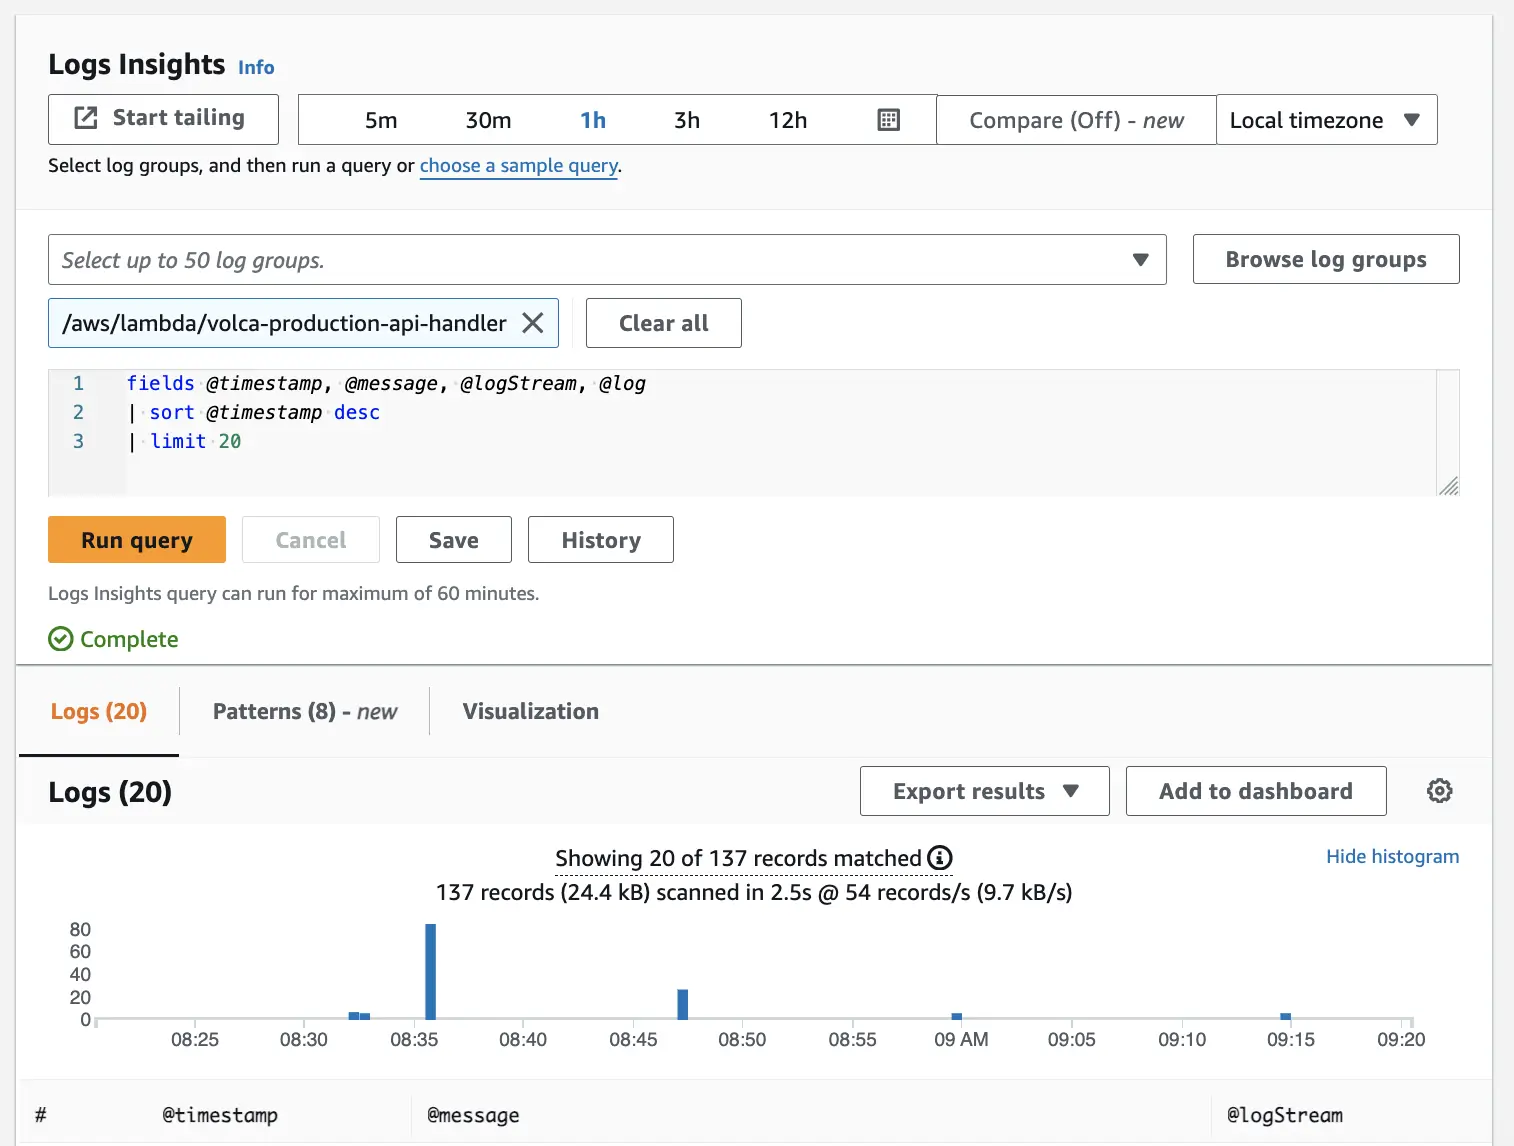
CloudWatch Logs Insights enables flexible querying of logs to quickly debug issues.
Examples
The default logger comes preconfigured with formatting and default log levels.
Here is an example of how it's used in the code base:
import { Logger } from '../utils/logger';const logger = new Logger();try {doSomething();} catch (error: unknown) {logger.error('Failed to do something');throw error;}
By default, a correlation ID will be attached to each log row that happens during an API request. This correlation ID can later be used in CloudWatch Logs Insights to query for all logs during an API request. This is very helpful during advanced troubleshooting. Here is an example of how a log row can look with all metadata included:
{"timestamp": "2022-10-29 14:52:55.1623","level": "info","message": "saving entity in database","correlationId": "83b7925b-3619-4b74-97da-b8aac0635321"}
Support
FAQs
Frequently asked questions about Volca. Can't find what you are looking for? Feel free to contact us.
SaaS Starter Kit and Boilerplate
© 2024 SaaS Boilerplate and Starter Kit with Node.js and React - Volca.